





Listen to this post: Google AI Overviews in 2026: Track Traffic Drops and Wins in Google Search Console (Step-by-Step)
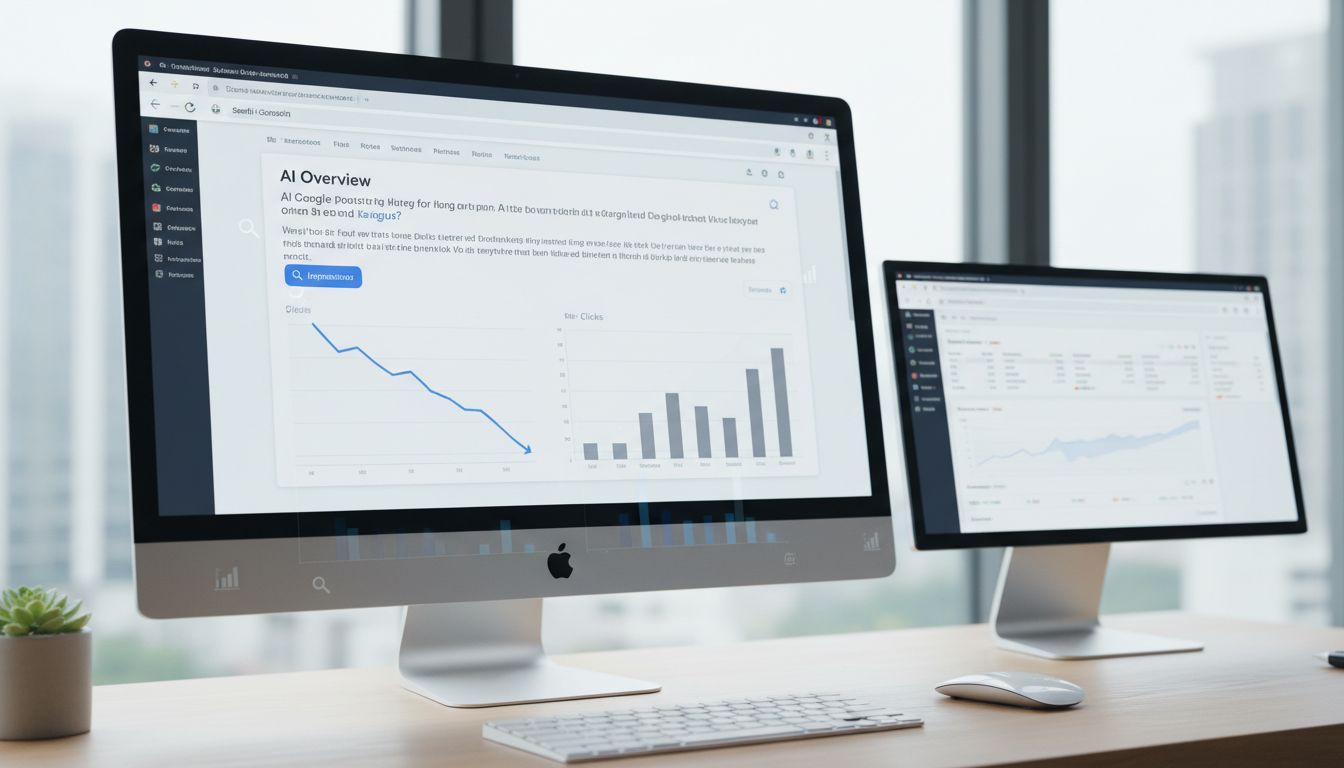
If your Google Search Console clicks have dipped while impressions look calm, it can feel like watching footfall pass your shop window without anyone coming in. In 2026, Google AI Overviews (part of broader SERP features) make that pattern more common, because zero-click searches often give users a good-enough answer before they ever see your blue link.
This guide shows how to measure losses and surprise wins in Google Search Console (GSC), using clean comparisons, tight filters, and a simple export workflow. You’ll end with a report you can act on, not a graph you stare at.
How Google AI Overviews change clicks, CTR, and “AI search visibility” in 2026
AI Overviews sit above classic results for many informational queries, the types of searches triggering summaries, so the old relationship between rank and clicks has weakened with notable CTR impact. Your page can still appear often (impressions), yet attract fewer visits (clicks), because the summary satisfies the query first.
Industry reporting has put numbers on the shift. For example, Search Engine Land covered research suggesting large click-through rate drops when AI Overviews appear; see Google AI Overviews drive CTR drops. Treat the exact percentage as context, not gospel for your site, because impact varies by topic and intent.
Meanwhile, AI Overviews keep changing. Reports in early 2026 describe a move to a newer Gemini model for AI Overviews and wider reach, which can amplify the effect across more queries, as Google selects “Citations and sources” for its summaries in a layout that contrasts with traditional “Featured snippets”; see Gemini 3 AI Overviews strategy notes.
One more trap: Google Analytics 4 can’t always tell you why organic demand changed, especially when the “answer” happens on the results page, as it struggles to track Generative AI traffic accurately. That’s why this workflow starts and ends in GSC, then uses exports for clarity. If you want to get GA4 as close as it can realistically get, our UTM rulebook for AI search attribution covers the setup. For background, see Why GA4 alone can’t measure AI SEO impact.
Step 1: Build a clean GSC comparison (so your charts stop lying)
First, use manual tracking to set a baseline in Google Search Console that matches how AI Overviews tend to fluctuate: by search intent, device, and date.
- Open Google Search Console → Performance → Search results.
- Set Search type to Web (avoid mixing in Discover).
- Click Date → Compare.
- Choose one of these comparison styles to help isolate search intent fluctuations:
- Last 28 days vs previous 28 days (good for ongoing monitoring).
- Custom (best for “before and after” an observed change, such as 10 Jan 2026 to 6 Feb 2026 vs 13 Dec 2025 to 9 Jan 2026).
- Turn on the four main metrics: Clicks, Impressions, Average CTR, Average position.
- Add one more control filter at a time:
- Device (mobile often shifts first).
- Country (AI features can roll unevenly, causing ranking fluctuations).
- Search appearance (review what options exist for your property, then segment if any AI-related or SERP features appearances show up).
If you don’t lock down dates and segments, you’ll blame AI Overviews for what was really seasonality, device mix, or a single country sliding.
Now you’re ready to diagnose patterns, not feelings.
Step 2: Run five GSC “recipes” to find drops, wins, and false alarms
Recipe A: Find sitewide impact (clicks and CTR drop, impression growth)
Use this when leadership asks, “Is it AI Overviews or did we break something?”
- Go to Performance → Search results.
- Keep Date → Compare set.
- Stay on the default Queries tab.
- Read the top line deltas:
- Impressions flat or showing impression growth, Clicks down, CTR down suggests demand is still there, but fewer people click.
- Add Device filter to see whether mobile leads the drop.
If you see this pattern, you’re not “invisible”. You’re being skimmed.
Recipe B: Find affected queries (question queries, long-tail, regex patterns)
AI Overviews often trigger on question-style and explanatory searches. You want to isolate those query buckets fast.
- Go to Performance → Search results → Queries.
- Click + New → Query → Custom (regex).
- Try these regex filters (one at a time) with regex query filtering:
- Question starters:
^(how|what|why|when|where|who)b - Long-tail keywords (rough proxy):
bw+b(s+bw+b){4,}(queries with 5+ words, often triggered by conversational prompts) - “Best/compare” intent:
b(best|vs|versus|compare|review)b
- Question starters:
- Sort by Clicks difference (compare mode) to surface the biggest losers and winners.
- Switch to Pages tab while the query filter stays active, to see which URLs take the hit.
This step often reveals a twist: some “best” queries win clicks because users still want options, while “what is” queries fade.
Recipe C: Find affected pages (top losers, top winners, intent match)
Pages don’t just lose traffic, some gain it, especially when they’re a strong follow-up resource.
- Go to Performance → Search results → Pages.
- Sort by Clicks difference.
- Open the top losing page, then click Queries to see what changed.
- Ask one blunt question: does the page answer the query in the first 10 seconds?
- If not, apply passage-level optimization and content engineering: tighten the lead, add a short definition, and improve headings.
- If yes, the loss may be SERP behaviour, not content quality.
For extra context on how AI Overviews reshape SEO priorities, compare notes with what changes for SEO in 2026.
Recipe D: Validate whether ranking stayed stable while CTR fell
This is the “AI Overviews fingerprint” many sites see: rank holds, clicks slip.
- In Performance → Search results, set Date → Compare.
- Filter to a suspected query (or regex group).
- Check these relationships:
- Average position stable (even with stable LLM ranking), impressions stable, CTR down: visibility stayed, attention moved.
- Average position improves, CTR down: you may be ranking higher, yet users still don’t need to click.
- Add Device and re-check. Mobile can show bigger CTR drops.
If the position line doesn’t move, chasing rankings alone won’t fix the gap.
Recipe E: Export and pivot (CSV, pre vs post deltas by query and page)
GSC charts are useful, but exports let you group, label, and calculate without squinting.
- In Performance → Search results, keep your Compare date range.
- Click Export (top right) and choose CSV.
- Export twice if needed:
- One export for Queries view.
- One export for Pages view.
- In Excel or Google Sheets, create a Pivot Table:
- Rows: Query (or Page)
- Values: Clicks, Impressions
- Add calculated fields (or helper columns) for CTR and Click delta (post minus pre).
- Group queries into buckets (Question, Long-tail, Brand, “Best”) using simple labels, then pivot by bucket.
This workflow turns “maybe it’s AI” into extractable insights: a ranked list of what changed, showing how brand authority can be a shield against traffic loss.
Step 3: Decision rules, reporting template, and what to do next
Use this simple table format for a heuristic analysis of your data to report outcomes and pick actions. Fill one row per segment you care about (sitewide, query bucket, top page, device).
| Segment | Impressions trend | Clicks trend | Avg position trend | Likely cause | What to do next |
|---|---|---|---|---|---|
| Impressions up, CTR impact down | Up | Down | Flat | AI Overviews soaking up clicks, or SERP feature shift | Rewrite intros for speed, add concise summaries, strengthen titles, add “next step” sections that make clicking worth it, and optimise for how AI Overviews choose their sources |
| Position up, CTR impact down | Flat or up | Down | Up | You rank better, but query gets answered earlier | Target deeper intent, add unique data, tools, comparisons, or original examples that AI summaries can’t replace |
| Impressions down, position down | Down | Down | Down | Ranking loss, content decay, or stronger rivals | Refresh content, improve internal linking, fix cannibalisation, and check indexing and technical issues |
| Impressions down, position flat | Down | Down | Flat | Demand drop or query rewriting | Expand to adjacent topics, update for 2026 language, add new angles, watch seasonality |
| CTR impact up, impressions flat | Flat | Up | Flat or up | Snippet wins, better match, or competitors weakened | Protect the win, improve related pages, and add supporting content to hold coverage |
Two practical rules keep you honest:
- If position and impressions are stable but CTR drops, treat it as a SERP behaviour problem first.
- If position drops, fix ranking issues before you blame AI Overviews.
Additionally, maintaining entity trust is vital for keeping your position when ranking against AI-generated content.
After you’ve classified each loss, pick one page to improve and one query bucket to expand. Use Google Tag Manager to track engagement with new summaries or accordion elements. Then re-run the same GSC comparison in 14 days. If you would rather not rebuild the filters each time, our single Looker Studio dashboard for AI Overviews makes this a standing report instead of a monthly chore.
Conclusion
Google AI Overviews have made “visible but not visited” a normal state in 2026. The fix starts with measurement in Google Search Console, because third-party SEO tools often lack the first-party data accuracy of this workflow. Google AI Overviews don’t just change rankings; they change clicking behavior. Set a clean comparison, run the five recipes, then label each outcome with a decision rule. Once you can name the pattern, you can choose the right move, and stop chasing the wrong graph. Mastering Google Search Console is the best way to handle the 2026 search landscape and improve your AI search visibility.