


Listen to this post: Are Carbon Markets Helping or Hiding Climate Inaction?
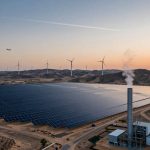
Picture a factory belching thick smoke into the sky. Its owner pays another firm elsewhere to cut emissions, claiming balance. Carbon markets promise this trade-off works. They cap total pollution and let companies buy or sell permits to stay under limits.
In January 2026, these markets boom. The EU Emissions Trading System (ETS) price sits at 92.24 euros per tonne as of 15 January, with forecasts for an average of 104 euros this year. China expands its system to steel and cement. Ships face new fees under the Carbon Border Adjustment Mechanism (CBAM) from 1 January. Have you heard of the EU ETS? It covers power plants and factories across Europe.
Global trade in these permits and credits surges. Firms chase net-zero goals. But do carbon markets drive real cuts, or do they mask delays? They force some change, yet critics spot flaws. Let’s unpack the facts.
How Carbon Markets Work in Today’s World
Carbon markets split into compliance and voluntary types. Compliance ones, like cap-and-trade, set hard limits. Governments issue permits for a fixed pollution amount. Firms that pollute less sell spares; others buy to comply. Think of it as slicing a pollution pie smaller each year.
Voluntary markets let companies offset emissions by funding projects, such as tree planting or clean energy. Buyers grab credits to meet self-set goals. Traders in London watch screens as prices tick up. In 2026, supply tightens fast.
The EU leads with its ETS, now the biggest. China follows with nationwide reach. Both add teeth this year.
EU ETS and the New Border Tax
The EU ETS caps emissions for over 10,000 sites. Prices climbed 5.59% in the past month to 92.24 euros per tonne. Analysts eye 104 euros average in 2026 from permit cuts.
CBAM kicks in fully on 1 January 2026. It hits imports like steel, cement, and aluminium with fees based on EU ETS prices. Importers buy certificates for embedded emissions. This stops firms dodging costs by shifting dirt abroad. Picture cargo ships at Rotterdam docks, facing bills that match local costs.
Free allowances end for steel and aluminium by 2034. Real costs rise from low levels now. For details on EU ETS trends and economic impact, check official data. Ships pay for methane and nitrous oxide too.
China’s Bold Move to Hard Caps
China’s ETS covers power now, but steel, cement, and aluminium join in recent expansions. It shifts to total emission caps, not just intensity targets. Old permits fade; prices climb as supply shrinks.
Vast steel mills in Hebei face cuts. Asia’s markets grow 36-58%. This covers more industries than before. Firms must buy allowances or pay fines.
For insights on China’s ETS reforms and enforcement needs, see recent analysis. Traders bet on tighter rules pushing clean shifts.

Photo by Centre for Ageing Better
Clear Wins: Where Carbon Markets Cut Pollution
Carbon markets deliver results when rules bite. The EU ETS raised over 175 billion euros since 2013. Caps drop yearly: 4.3% now, aiming for 62% cut from 2005 by 2030. Firms invest or pay up.
California’s system runs steady over years, cutting power sector emissions 10% below caps. Voluntary markets hit 1.7-3 billion dollars last year. New credits focus on quality.
Forests grow back; machines pull CO2 from air. Prices signal change.
Higher Prices and Real Penalties in Action
Shrinking supply lifts prices. EU cuts 90 million allowances in 2024, 27 million more in 2026. Firms face fines over 100 euros per tonne excess.
China’s caps force steel plants to idle dirty furnaces. More credits get retired, not resold, for true offsets. EU splits markets: one for reductions, one for removals.
Penalties work. A German cement firm swapped coal for biomass after costs soared.
Boom in Investments and New Tech
Firms pour cash in. Banks like Barclays snap removal credits. Over a dozen direct air capture plants start by year-end.
Asia leads renewables. Investments topped 10 billion dollars in 2025 for credits. CBAM spurs global tweaks; China eyes paths to comply, per this report on Guangdong strategies.
Tech blooms: factories capture waste heat; ships burn green fuels.
The Risks: Hiding Inaction Behind Trades
Markets shine, but pitfalls lurk. Firms buy cheap credits abroad instead of fixing home plants. Past scandals taint trust: credits from forests that would stand anyway.
Supply stays tight for real offsets. Prices crash on shocks, like gas wars. Rules vary; benchmarks form slow. Do trades just shuffle pollution?
A oil giant claims net zero with offsets, yet drills more. Balance demands scrutiny.
Greenwashing and Dodgy Credits
Voluntary credits often flop. Many projects cut no extra emissions; baselines prove fake. Firms skip own cuts, buying offsets at low cost.
Market stays small versus compliance. Quality rules tighten, but gaps remain. A airline offset flights with dodgy hydro projects.
See China-EU CBAM tensions and fixes for border risks.
Shocks and Uncertain Rules
Prices swing wild. Ukraine war spiked gas; costs tumbled. Weather hits hydro credits.
Policies shift: elections tweak freebies. Benchmarks for removals lag. Shipping adds volatility with new gases.
Traders brace for 2026 tests.
Weighing the Scales on Carbon Markets
Carbon markets tighten caps and draw billions, yet they pair best with direct rules like taxes or bans. EU and China prove prices spur cuts; CBAM levels fields. Wins stack: emissions drop where enforced.
Risks persist without oversight. Greenwashing erodes faith; shocks test nerves.
Watch 2026 data. Will global emissions bend? Push leaders for hard caps and checks. What steps will you take? Real action beats trades alone. Thanks for reading; share your view.
(Word count: 1487)