


Listen to this post: Weather Storms, Supply Pinches, and Surging Commodity Prices
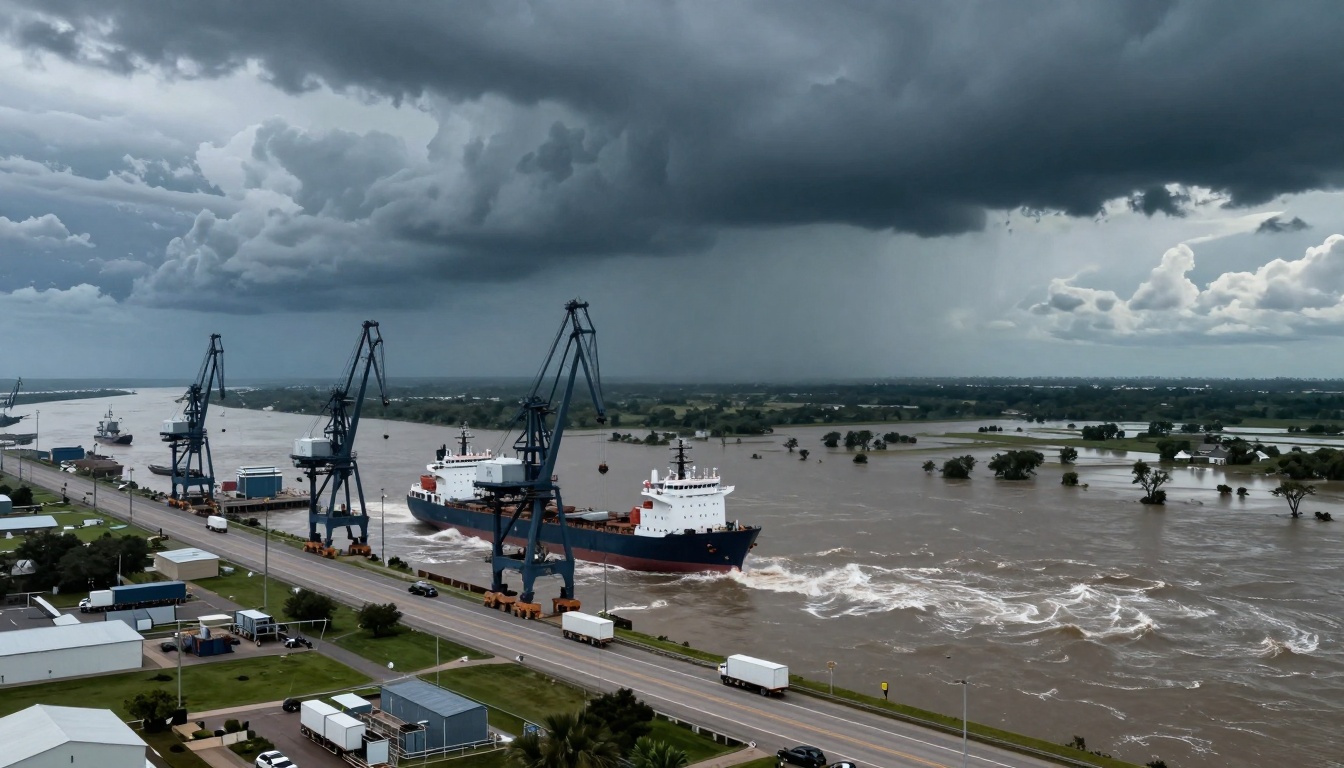
Picture a busy port in Texas. Towering cranes stand idle as Hurricane Melissa’s fierce winds lash the coast. Ships bob wildly offshore, unable to dock. Miles inland, fields lie underwater from flash floods along the Guadalupe River. Factories halt, trucks idle on blocked roads. In hours, a storm turns plenty into scarcity.
This scene played out in 2025. Weather events like these tighten supplies, push up costs, and jolt markets. Prices for oil, wheat, and freight climb fast. You’ll see how this chain works, from storm damage to empty shelves. We’ll cover real cases from 2025 into early 2026, plus signs to spot next moves.
How Weather Turns into a Market Shock, from Storm Clouds to Price Spikes
Storms hit hard and fast. They cut output, block routes, and spark bids for what’s left. Commodity prices jump on exchanges before you notice at the till. Supply chain disruptions spread the pain.
The Three-Step Chain: Damage, Delay, Then a Scramble for Limited Supply
Step one: damage strikes. Floods drown crops. Winds topple refineries. The North Dakota EF-5 tornado in June 2025 wrecked farms and derailed trains carrying grain.
Step two: delays pile up. Roads flood. Rivers swell or run dry. Ports close, as seen with Gulf hurricanes. Goods sit stuck.
Step three: buyers scramble. Firms chase remaining stock. Spot prices soar. Futures contracts shift. Just-in-time stocks, lean by design, make shortages bite deeper. Factories idle without parts. Retailers ration shelves.
Why Markets Move First, and Household Prices Follow Later
Markets react in minutes. Traders see satellite images of floods and sell futures. Oil jumps on port closures. Wheat climbs on drought news.
Your bills lag. Supermarkets hold fixed contracts. Power firms smooth regulated rates. But diesel costs rise, then delivery fees. Food prices follow weeks later. A blocked rail line meant higher lorry fuel in 2025, adding pennies to bread loaves over months.
The Supply Pinch in Real Life: Recent 2025 to Early 2026 Patterns Hitting Food, Energy, and Shipping
The US faced 23 billion-dollar weather disasters in 2025 alone. Storms, floods, heat, and fires cost $115 billion. They hit farms, roads, and energy hard. Global ripples followed, from Pakistan floods to Indonesian cyclones. Extreme weather reshaped food supplies, with crop losses driving shortages.
Severe Storms and Floods: Broken Power, Closed Roads, and Delayed Deliveries
Tornado outbreaks ripped through the Midwest. Six billion-dollar events damaged silos and barns. Texas floods in July swept campsites and farmland, the sixth-deadliest US freshwater flood.
Power lines snapped in March winds. Factories went dark. Trucking halted on icy blasts or flooded lanes. Retailers missed stock. Rebuilds boosted demand for steel and timber. Insurers hiked rates after repeated hits. Check Fox Weather’s report on supply chain strains for vivid details.
Heat and Drought: Smaller Harvests and Pricier Inputs for Food and Industry
June’s heat wave shattered 3,000 temperature records. Fields baked. Workers cut hours. Yields fell for corn and soy.
Hydropower dipped in parched areas. Utilities burned costlier gas. Livestock feed prices rose, lifting meat costs. Chemical plants, thirsty for water, slowed. Futures priced in poor crops early. India’s 2025 heat wave cut wheat further.
Low Water on Rivers and Canal Limits: When Ships Carry Less, Everything Costs More
Droughts shrank the Mississippi and Rhine. Barges loaded light to avoid grounding. Firms switched to lorries or rail, burning extra fuel.
Freight rates doubled on key routes. Imported grains and fuels cost more. Chemicals and metals followed. Pacific Northwest floods in December added chaos, washing out bridges.
Knock-on Costs: Where the Extra Bill Shows Up in Inflation, Earnings, and Your Weekly Shop
First shortages fade. Then linger costs hit. Fuel surcharges stick. Insurers demand more. Firms build buffers, tying up cash. These feed inflation and squeeze profits. Aon’s analysis flags commodity risks climbing.
From Higher Freight and Fuel to Higher Shelf Prices: The Hidden Mark-Ups
Ports close, say from a Gulf storm. Ships reroute via longer paths. Fuel burns up. Goods spoil in delays without cold trucks.
Warehouses empty. Promotions halt. Shops add surcharges. A banana shipment from flood-hit Central America arrives late, bruised. Price tags creep up 10%. Plastics for packaging, energy-linked, add another layer.
Insurance, Repairs, and Borrowing Costs: The Slow Burn after the Storm
Repeated storms mean premium hikes. Firms face big deductibles. Lenders eye risky sites warily.
Operating costs climb. Expansions pause. Earnings reports cite weather hits, shares dip. Wildfires and mudslides in California December 2025 forced rebuilds, straining builders’ books.
What to Watch Next: Practical Signals That Weather Might Move Markets Again
Stay ahead with simple checks. Weather apps flag risks near farms or ports. Markets hint at trouble early. No crystal ball needed.
Early Warning Signs: Forecasts, River Gauges, Port Alerts, and Crop Reports
Severe warnings near Gulf ports signal oil snags. Low Mississippi gauges mean barge woes.
Drought maps track harvest threats. Crop scouts report field stress. Heat spikes lift power use, straining grids.
Market Tells: Freight Spikes, Widening Spreads, and Sudden Jumps in Key Commodities
Spot freight rates climb first. US-Europe gaps widen on reroutes.
Oil or maize futures leap on storm paths. Volatility grows if traders eye repeats. World Bank’s October 2025 outlook tracks these shifts.
Storms pinch supplies at key spots like ports and rivers. Delays fan costs into inflation and thinner earnings. Track gauges and futures to spot surges early.
In January 2026, watch Atlantic patterns and drought updates. What weather signal have you seen move prices lately? Share below.